Twitter Search Tools
Twitter popped quiet quickly to my mind when I decided to start my next side project. This time I wanted to mine the social map and hone my skills with API access and working with different types of data. The web is a reliable source to get started with this. With help of the great book "Mining the Social Web" by Matthew A. Russel and a PDF document authored by Joe Bob Hes, I got started to design my own search tool. The process can be easily divided into four major steps:
Step 1: Get OAuth credentials
Step 2: Set up your script
Step 3: Wrangle your data
Step 4: Visualize your data
Step 1:
Twitter has a great site with many pages explaining the OAuth system. My plan was to search and stream Twitter. First, you have to create an authentication. Start by visiting https://apps.twitter.com/ and follow the instructions given here: https://dev.twitter.com/oauth/overview/application-owner-access-tokens. Please see the following document for an excellent description of how to obtain the fixed and variable parameters: http://coding2day.com/TwitterPython.pdf.
Step 2:
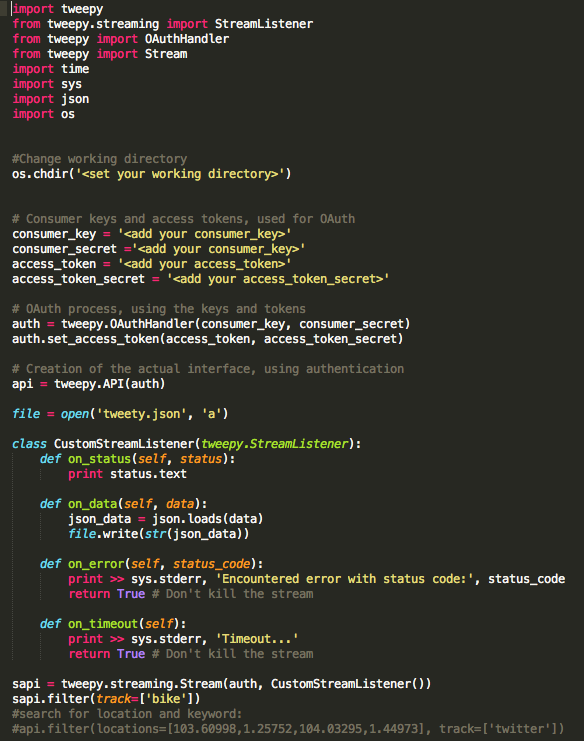
Once you have everything together and you can start setting up your first search script.
You need a set of modules for the authentication process:
Step 1: Get OAuth credentials
Step 2: Set up your script
Step 3: Wrangle your data
Step 4: Visualize your data
Step 1:
Twitter has a great site with many pages explaining the OAuth system. My plan was to search and stream Twitter. First, you have to create an authentication. Start by visiting https://apps.twitter.com/ and follow the instructions given here: https://dev.twitter.com/oauth/overview/application-owner-access-tokens. Please see the following document for an excellent description of how to obtain the fixed and variable parameters: http://coding2day.com/TwitterPython.pdf.
Step 2:
Once you have everything together and you can start setting up your first search script.
You need a set of modules for the authentication process:
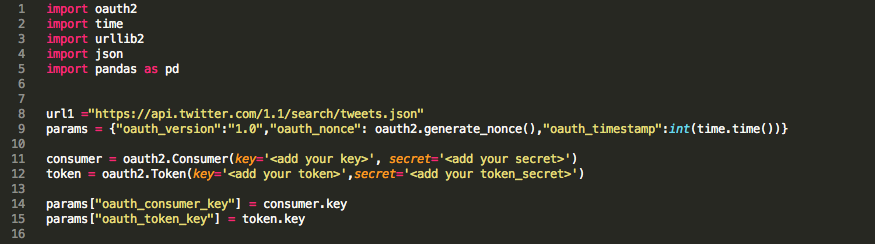
Running this piece of the script should create all parameters required for your search. Twitter provides an extensive explanation of search parameters (https://dev.twitter.com/rest/reference/get/search/tweets) and how to build a query (https://dev.twitter.com/rest/public/search). So lets see how the script looks:
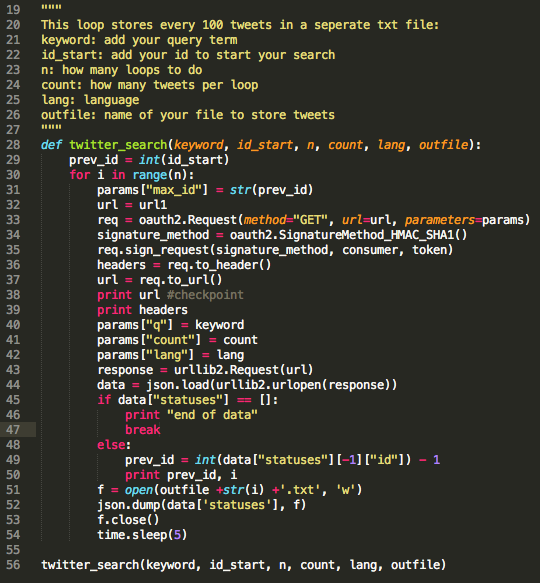
Working with the parameter prev_id comes in super handy. You can determine a time window for which you would like to pull down tweets for a given search query. I typically check out twitter big ben (https://twitter.com/big_ben_clock) for an ID for a given time/date. Check out this PDF for a detailed explanation of the parameters and the max_id/prev_id (http://coding2day.com/TwitterPython.pdf).
Step 3:
This is the fun part. While most people recommend to write a specific query and extract only the part of the data which you need for your further analysis, I am just a beginner. First, I needed to understand better how the output looks like. I quickly decided that coordinates, id, text, and dates are a good starting point.
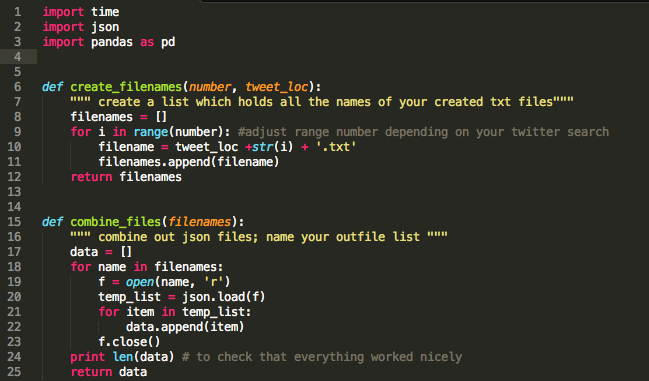
The data returned by the function "combine_files" is a list where each item represents a "tweet". Using json as data format allows you to save your data structure which is important for the following steps. I thought creating two dataframes would be a good idea: a) id, text, date and b) coordinates.
a) Creating dataframes from twitter data using pandas:
The two functions get_info and get_coordinates are designed to extract only the information which I would like to have for my downstream analysis.
a) Creating dataframes from twitter data using pandas:
The two functions get_info and get_coordinates are designed to extract only the information which I would like to have for my downstream analysis.
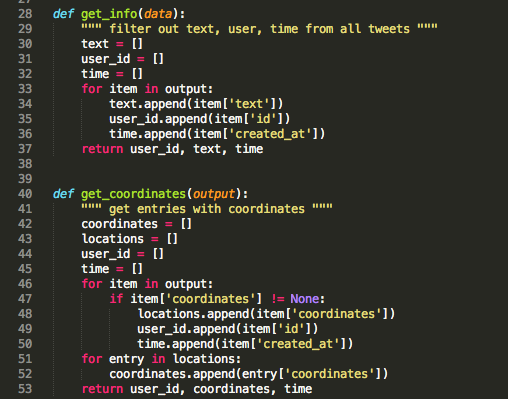
This will create two pandas (pd) dataframes (df) containing either text, id, and created_at or coordinates, id, and created_at.
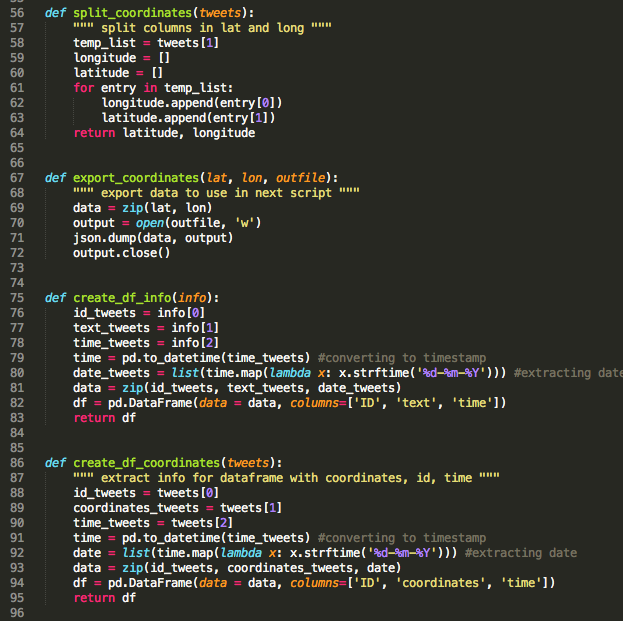
I also included at this point two functions which will return coordinates for mapping tweets at a later point. Now it is time to call all the functions and create some output.
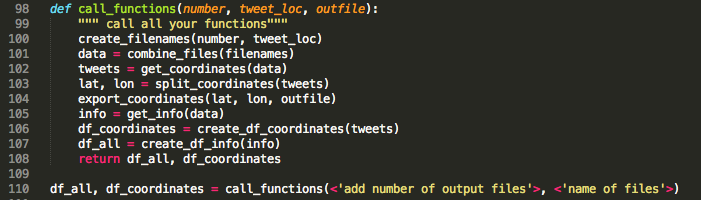
Step 4:
The presentation of data in a graphical format (=data visualization) is an integral part of a scientist's (my) life and as it turns out, this is also true for data scientists (yay - I like that!!!). Some time ago, I read this article featuring this pretty map displaying the ratio of bacon-to kale mentions on Twitter.
The presentation of data in a graphical format (=data visualization) is an integral part of a scientist's (my) life and as it turns out, this is also true for data scientists (yay - I like that!!!). Some time ago, I read this article featuring this pretty map displaying the ratio of bacon-to kale mentions on Twitter.

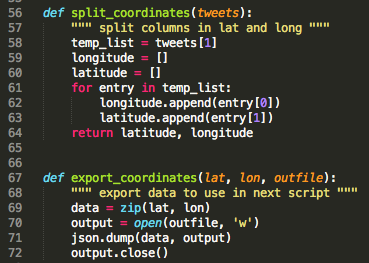
Seeing this inspired me. What does it take to create a map of my twitter data? As usual, I started out scanning the web for hints, ideas and written scripts which might help me to realize my aim. I knew how to map my tweet counts to the world map by now (see PubMed project), so how hard can it be to do this on a US state scale. I needed to find a way to match my coordinates to countries, filter out tweets stemming from the US and retrieve state information for these. First, I exported and saved my data as json files.
Note: I have shown this piece of script already further up since I eventually integrated the coordinates and export function in the initial processing step.
Note: I have shown this piece of script already further up since I eventually integrated the coordinates and export function in the initial processing step.
I found this great webpage. It was exactly what I was looking for (http://blog.jverkamp.com/2012/10/25/determining-country-by-latitudelongitude/). You need quiet a few modules to run this script, but all of them are easy to install. Detailed information on Cartopy can be found here: http://scitools.org.uk/cartopy/.
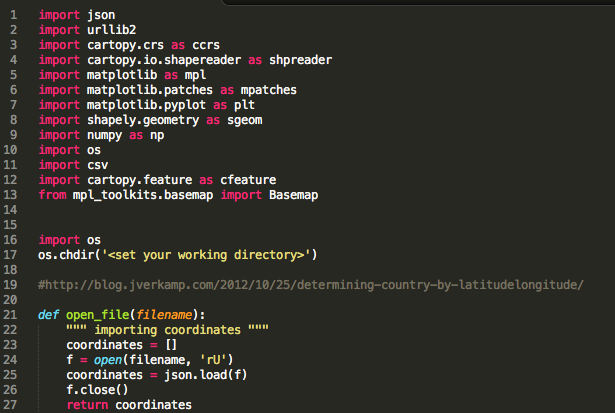
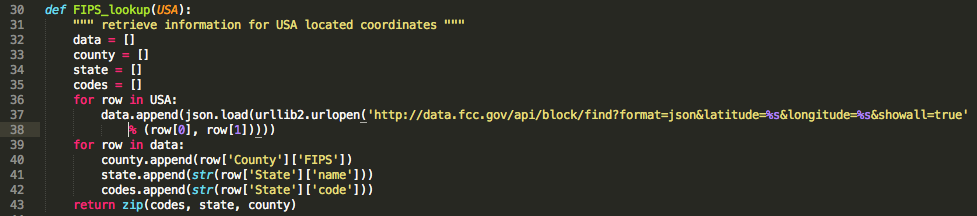
I opted to export and import my data to a new notebook, but this is entirely optional. The function below returns at the end a list containing for each coordinate (in case the coordinates are found to be located in the US) the FIPS, state, and county.
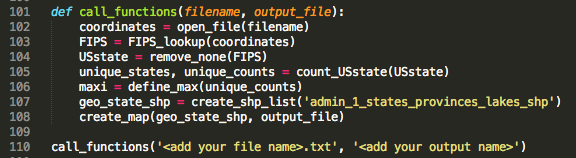
Similar to the steps involved in creating a world heat map (see Twitter Project), you have to generate a set of lists which will be used in your final plot function.
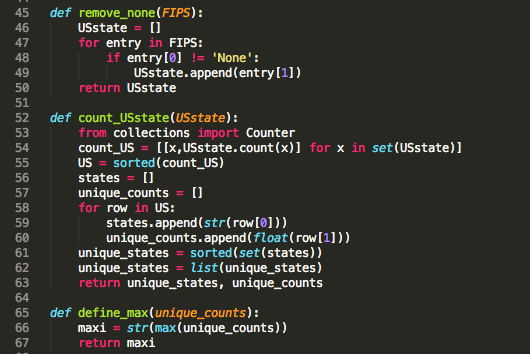
With maxi, unique_states and unique_counts, the next step is to get your map set up:
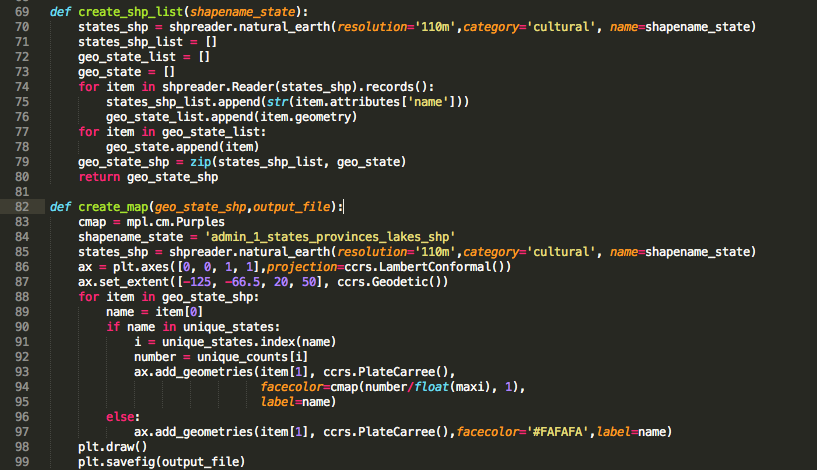
DONE!!! Calling your final function which will tie everything together should give you a beautiful map!! You can chose colors by adjusting cmap. If you want to blot log scale or scale your data differently, facecolor is the place to look at (here: cmap(number/float(maxi),1).
Example: "tennis" vs "golf" vs "bike" --- Which is the most popular sport?

Peter Sagan
|
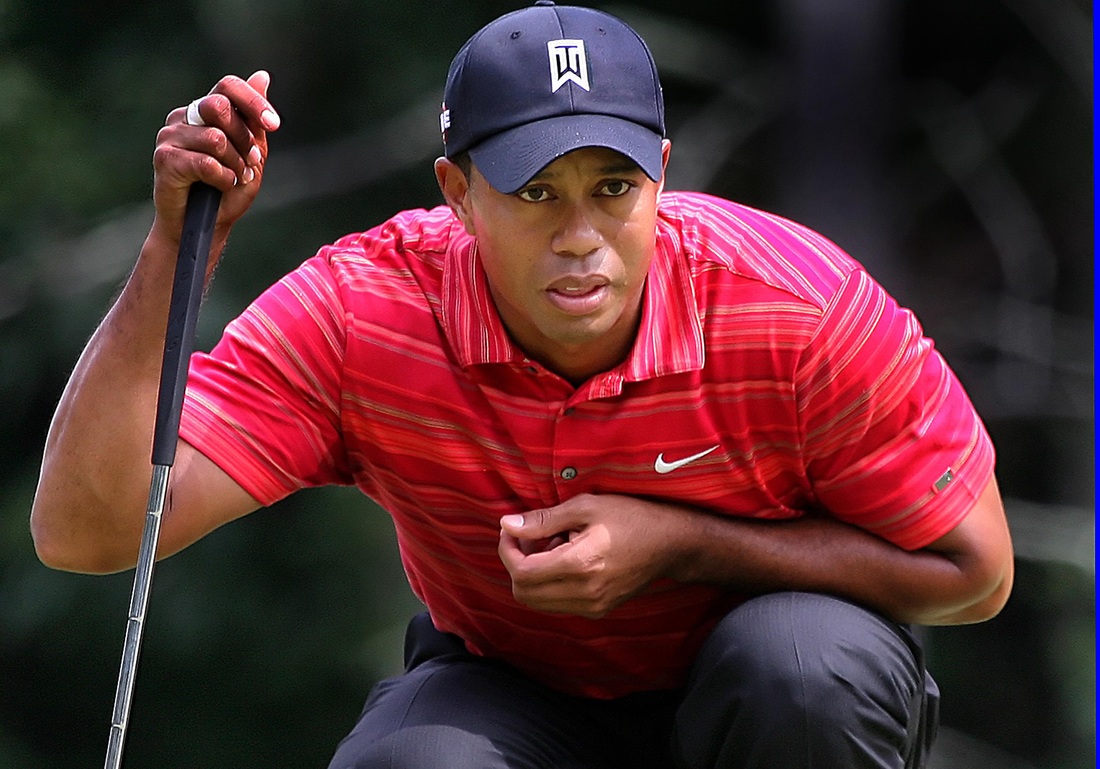
Tiger Woods
|

Roger Federer
|
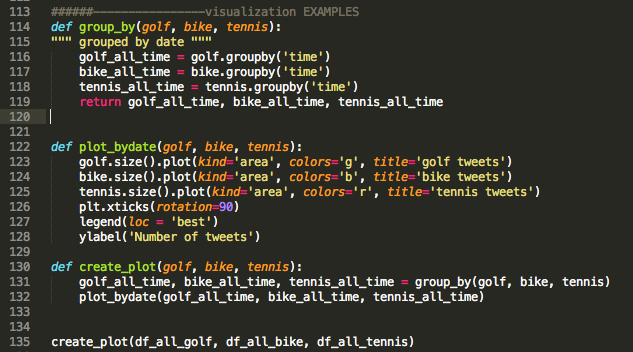
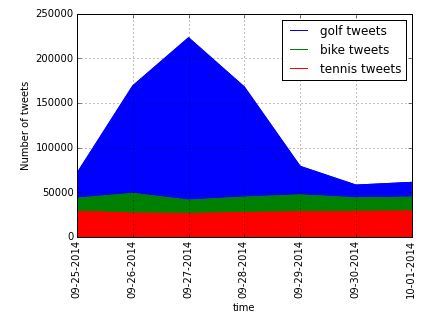
I am a pretty active person and spend most of my time on my road bike. I don't know how often I have been told that California is the place where the most healthy, active, outdoorsy people live. I thought, with my functions set up, I have the tools to actually look at this from a "tweet perspective". Out of curiosity, I first looked at the number of tweets over time (7 days) for all three query terms (regardless of location, limited to "lang" = eng). What is the most "popular" sport among the three? My guess: GOLF!
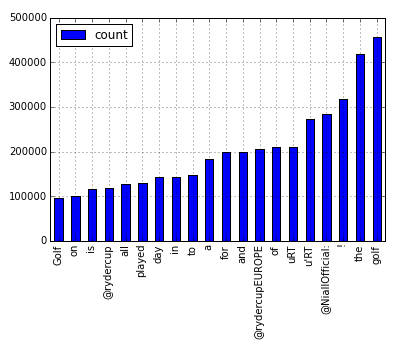
Interesting! Bingo! The "popularity" of these three different sports seems to be as following based on the tweet count: tennis> bike > golf. Ok, this result is a little biased. As it happens the 2014 Ryder Cup took place in Scotland last weekend (September 23 – 28, 2014).
Counting words showed that the Ryder Cup was a major tweet topic.
Counting words showed that the Ryder Cup was a major tweet topic.
|
|
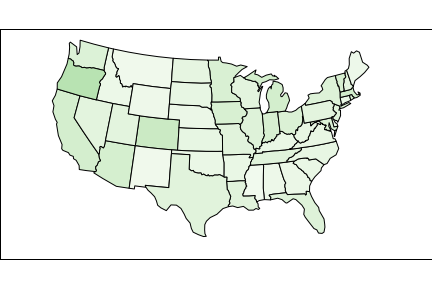
Let's address my initial question: the geographical distribution of the tweets for each query.
Total Count per U.S. State

Tennis
|

Bike
|

Golf
|
This looks pretty good for California, but it looked a little suspicious to me. Especially since the states with the highest population looked pretty good. In order to normalize for the different size of each state, I changed my script and added the population factor in. The maps below show number of tweets per capita for each state compared to total number of tweets shown above. INTERESTING!!!
Number of Tweets per Capita

Tennis
|
Bike
|

Golf
|
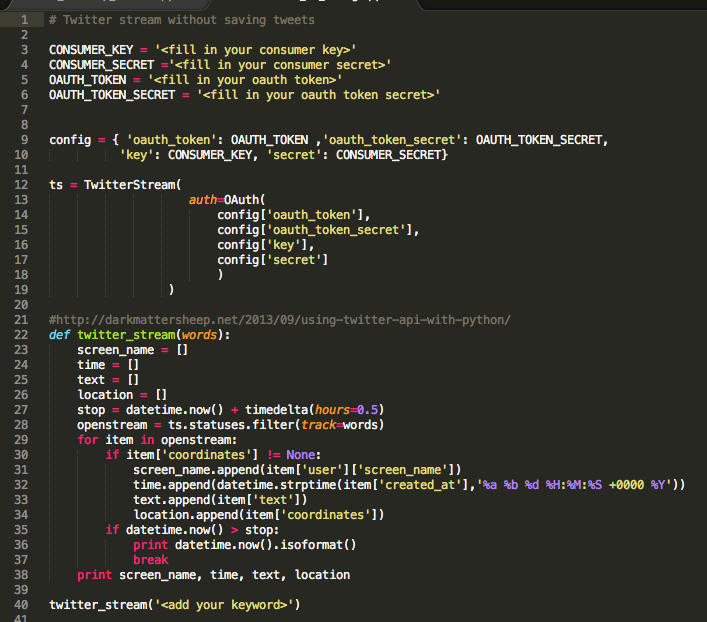
Tweetstream
Another way of working Twitter is to read tweets "live". It's kinda fun to watch what people have to say to a specific subject (keyword or hashtag search). The Search API is not complete index of all Tweets, but instead an index of recent Tweets. At the moment that index includes between 6-9 days of Tweets (https://dev.twitter.com/rest/public/search). In order to collect data/information over a longer time period, you could run a livestream for a period of choice. I came across two different scripts of which one allows you to save your tweets. You might want to play around with it. If you know what kind of information you are looking for, you can keep the file a little smaller;) I am just about to work with it a little more.
A. Save your tweets in tweety.json
B. Without saving (source)