PubMed Search Tools
|
|
|
As a scientist who is searching daily for information/articles using PubMed, it's not surprising that my first side project was somehow related to the search engine.
I have been working in the genomics field since seven years and have seen exciting technological development. I started out spending hours sequencing 12 exons of my gene of interest (n= 100 patients!!!). Exon by exon had to be amplified, purified, prepared for sequencing, and later results had to be manually analyzed (one by one).
Nowadays, we easily sequence the whole exome/genome or focus on larger targeted gene panels specifically designed for our purposes. In that way we can generate a huge amount of data.
Things have changed!
I wanted to see how this is reflected by the occurrence of defined terms in PubMed (title or abstract):
The script I wrote allows you to search for your favorite terms in PubMed (title/abstract body). You can collect PubMed identifiers (PMID) count the occurrence of different terms in title and/or abstract, pull down journals, titles, article types, affiliations of authors, year of publication, and so on. Whatever your heart desires!!
As a newbie to python, I started out using some public tutorials...a great read: BioPython
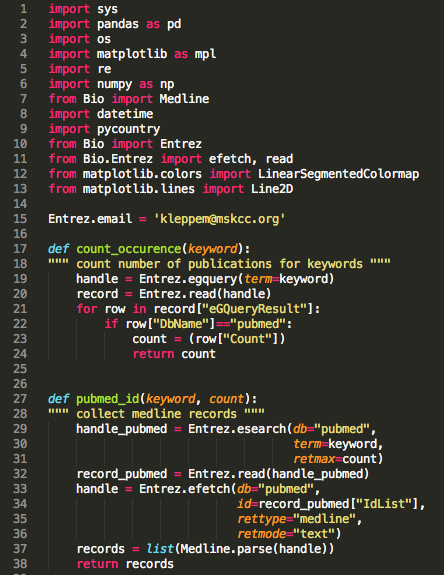
Step 1: Set up your script to retrieve records
Step 2: Wrangle your data
Step 3: Visualize
Step 1:
The first step involves getting access to PubMed and retrieving Medline records for your keyword.
I have been working in the genomics field since seven years and have seen exciting technological development. I started out spending hours sequencing 12 exons of my gene of interest (n= 100 patients!!!). Exon by exon had to be amplified, purified, prepared for sequencing, and later results had to be manually analyzed (one by one).
Nowadays, we easily sequence the whole exome/genome or focus on larger targeted gene panels specifically designed for our purposes. In that way we can generate a huge amount of data.
Things have changed!
I wanted to see how this is reflected by the occurrence of defined terms in PubMed (title or abstract):
- whole exome sequencing
- whole genome sequencing
- array CGH
- RNA seq
- CHIP seq
- sanger sequencing
The script I wrote allows you to search for your favorite terms in PubMed (title/abstract body). You can collect PubMed identifiers (PMID) count the occurrence of different terms in title and/or abstract, pull down journals, titles, article types, affiliations of authors, year of publication, and so on. Whatever your heart desires!!
As a newbie to python, I started out using some public tutorials...a great read: BioPython
Step 1: Set up your script to retrieve records
Step 2: Wrangle your data
Step 3: Visualize
Step 1:
The first step involves getting access to PubMed and retrieving Medline records for your keyword.
Step 2:
Next, you have to decide what you would like to analyze/look at. For my first run, I chose the following fields: publication date, pmid, journal title, affiliation, and article type. FYI: I prefer to split my code up in smaller functions. In this way, I can easily debug my code.
Next, you have to decide what you would like to analyze/look at. For my first run, I chose the following fields: publication date, pmid, journal title, affiliation, and article type. FYI: I prefer to split my code up in smaller functions. In this way, I can easily debug my code.
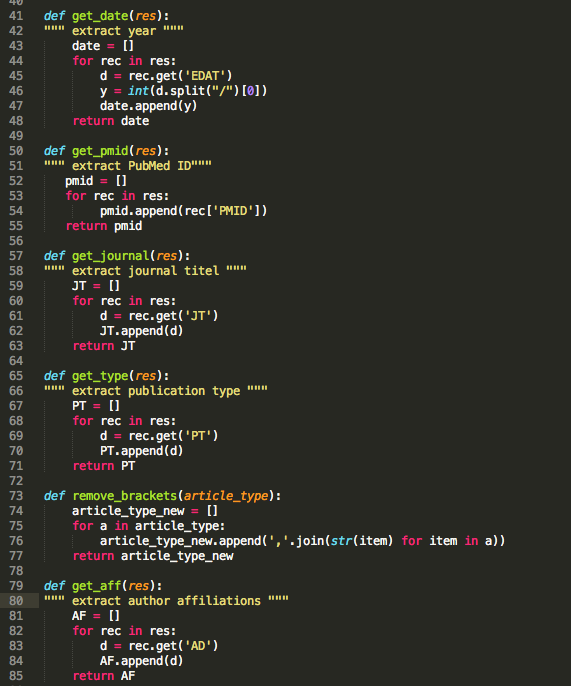
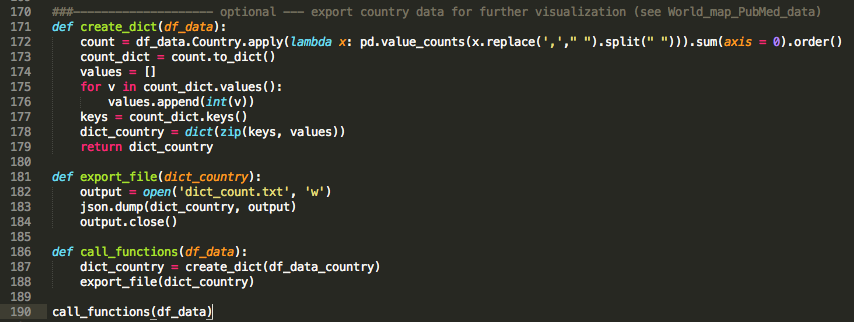
At this point, I decided it is a good idea to extract the country from the affiliations rather than looking at specific groups. I was curious to see how the #publications are distributed world-wide. I used the pycountry module to create a country list and intersected it with each affiliation entry. I have to point out that quiet a number of journals does not include country names in their affiliation field (STRANGE!!). I am currently working on cities --> country to solve this problem.

Time to call my functions and get the information I need for my analysis.
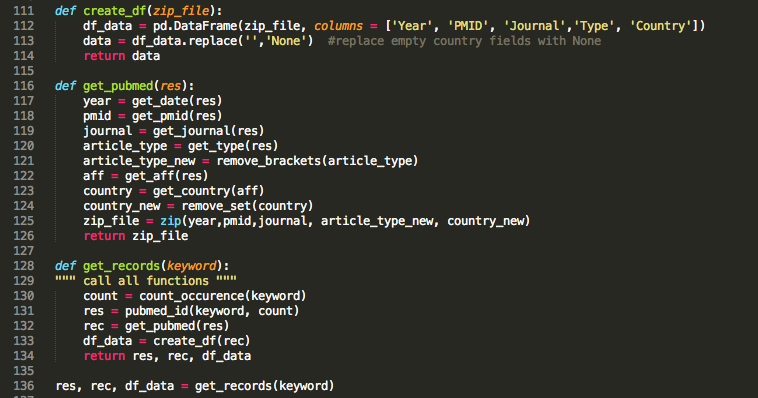
All the data are now stored in a pandas dataframe and ready to use for plotting (YAY!!)
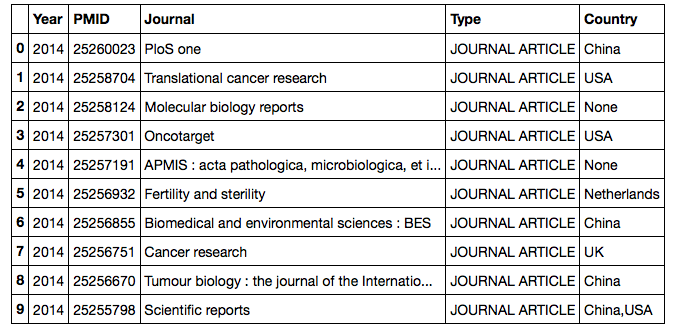
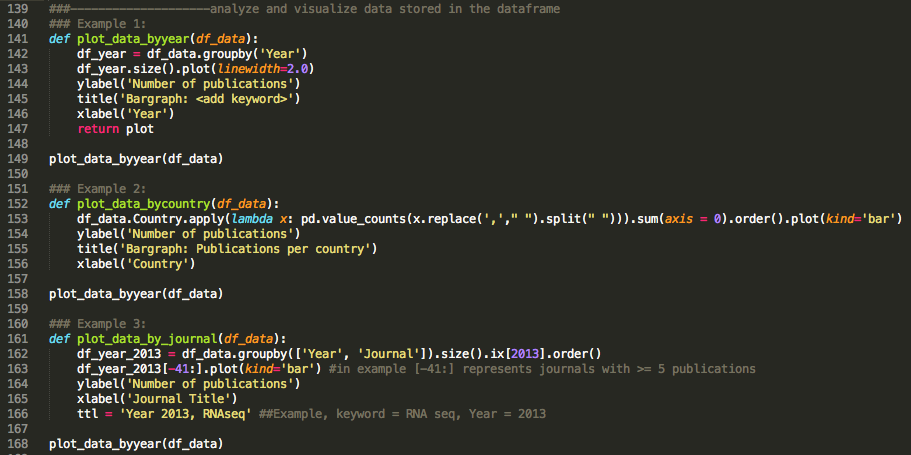
Part 3:
There are endless options to analyze and visualize this table depending on the initial question you would like to address. A few examples can be found below: (see Wes McKenney's video on youtube for a great introduction to pandas)
There are endless options to analyze and visualize this table depending on the initial question you would like to address. A few examples can be found below: (see Wes McKenney's video on youtube for a great introduction to pandas)
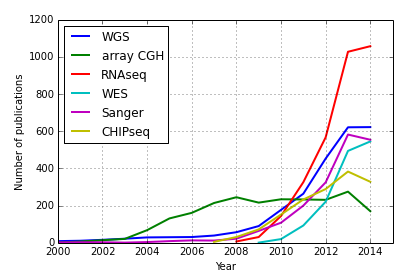
Comparison of novel sequencing technologies
|
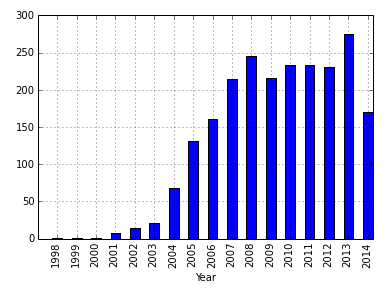
Number of publications mentioning array CGH
|
The line graph above depicts an increased frequency of research projects using novel "sequencing" technologies. This nicely highlights that we can characterize the use of genome sequencing technologies in biomedical publications over the last decade by interrogating the PubMed database.
Query: "RNA seq"
|
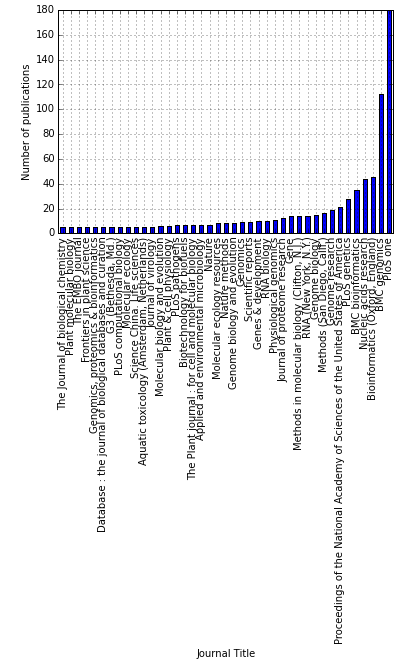
Publications in 2013; query: "RNA seq"
|
Creating a world map
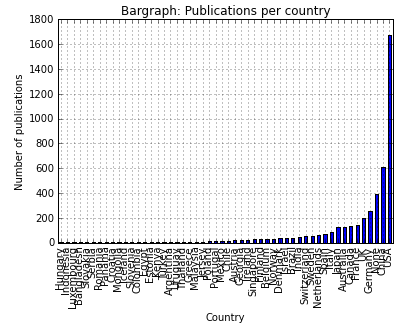
I have conducted research in five different countries (United States, Belgium, New Zealand, Denmark, and Germany). Having the country data at hand from the previous analysis, I next wanted to create a heat map of the world depicting the number of publications per country.
For this purpose, I exported some of the data from the PubMed query (json.dump()).
For this purpose, I exported some of the data from the PubMed query (json.dump()).
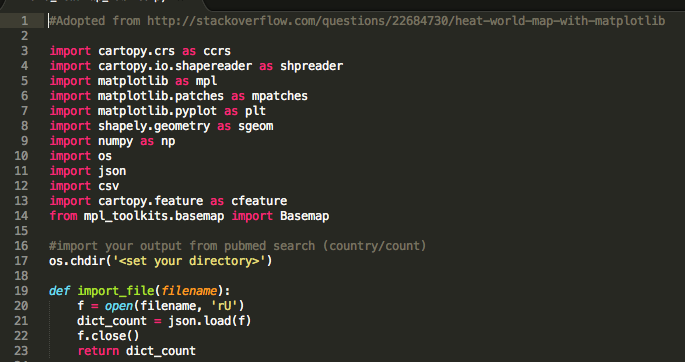
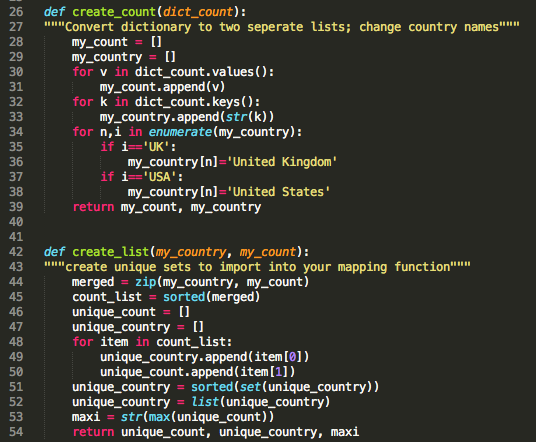
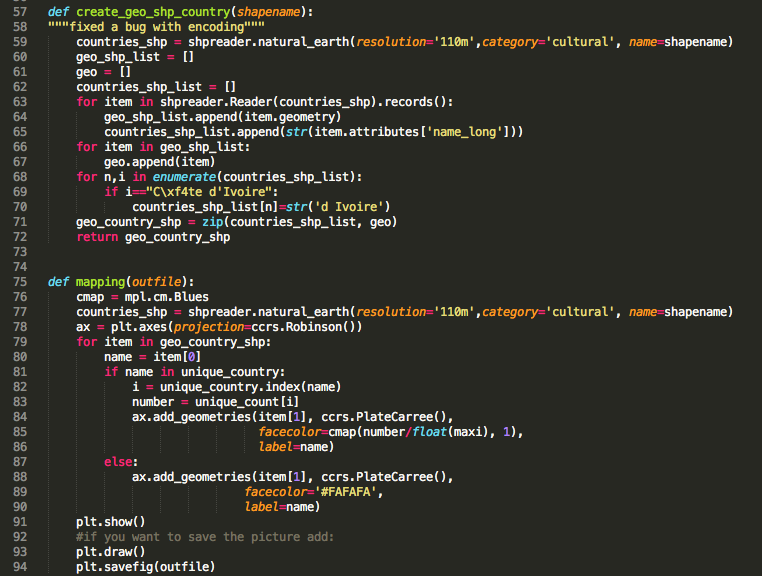
In order to map your data, you need to create a set of variables: unique_count, unique_country, and maxi. In addition, you have to create a basemap. I faced some problems with my country names. Some journals use abbreviations and others don't. You have to be careful to keep the count/country association intact. You will need this later during the mapping process.
You are taking advantage of Cartopy's integrated shapefile reading with Shapely capabilities to create your map. In contrast to the US State Map (see Twitter project), we are using this time a different shapename ('admin_0_countries') to create the countries_shp file which contains all the required geometrical information.

Query: 'cancer sequencing'

Zoomed to Europe
As I have mentioned before, some of the journals do not include the country information. I am currently working on a script which will extract every city and return the corresponding country.
Another side note: I haven't normalized the number of publications for the size of each country. Can be done easily. Would be interesting to compare Europe as entity to the U.S. in respect to publication numbers.
Another side note: I haven't normalized the number of publications for the size of each country. Can be done easily. Would be interesting to compare Europe as entity to the U.S. in respect to publication numbers.
