Crime analysis.
What questions have crossed your mind when you need to decide where you would like to move in a city. Among parameters such as good schools and access to public transportation, crime is an important factor. Once you have data at hand as provided by the SFPD (three month period), you can find out a lot about a district.
Q's:
1. What is the most common crime type/category in San Francisco?
2. Does the number of crimes differ depending on the day of the week?
3. What is the most dangerous time of the day?
4. Which district has the lowest crime?
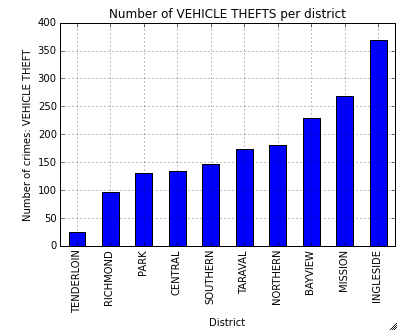
5. Which district has the highest number of stolen cars (last three month)?
6. Is there any specific association between crime types and districts?
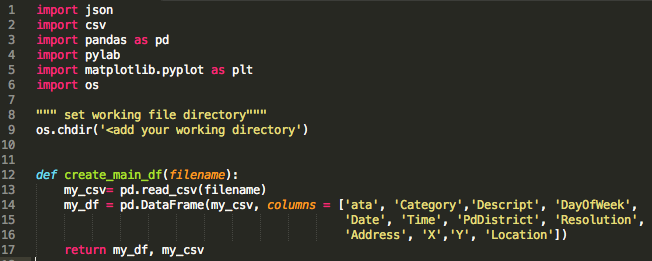
First, you have to get your data into Python. I downloaded the data as csv file (json is another great alternative) and used the csv module to read it, created a dictionary and a main dataframe holding all the information. The main dataframe served as starting point for all my analysis.
Q's:
1. What is the most common crime type/category in San Francisco?
2. Does the number of crimes differ depending on the day of the week?
3. What is the most dangerous time of the day?
4. Which district has the lowest crime?
5. Which district has the highest number of stolen cars (last three month)?
6. Is there any specific association between crime types and districts?
First, you have to get your data into Python. I downloaded the data as csv file (json is another great alternative) and used the csv module to read it, created a dictionary and a main dataframe holding all the information. The main dataframe served as starting point for all my analysis.
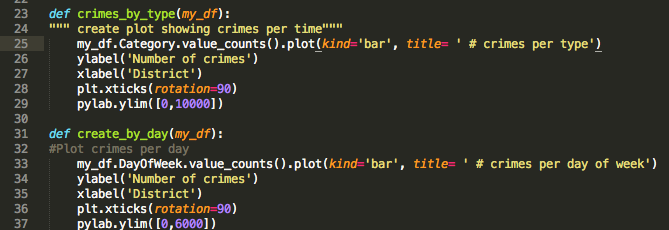
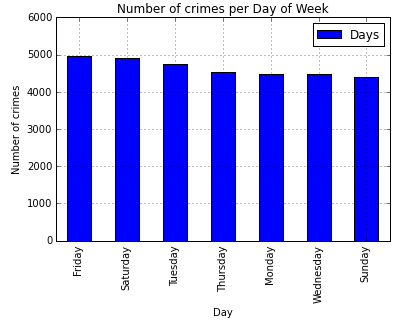
Lets answer some general questions. The two functions below allow you to look at the number of crimes per type (eg. vehicle theft, assault, non-criminal) and to find out if there are differences in the number of crimes happening on different days of the week (eg. more crimes on Saturdays compared to a weekday).
|
|
|
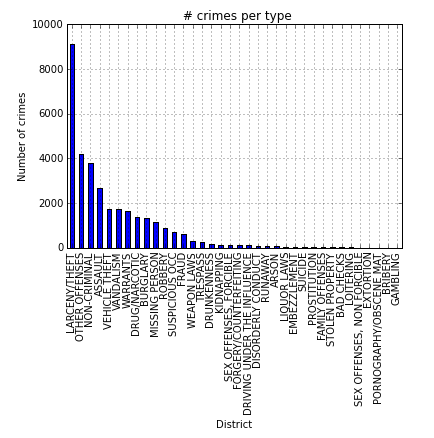
Larceny/theft forms the largest crime category in San Francisco with about 9000 cases in the last 3 month. Other offenses and non-criminal delicts take up places 2 and 3, respectively.
|
Surprisingly, the data showed that Sunday was the day with the lowest crime frequency. I would have expected a crime increase over the weekend.
|

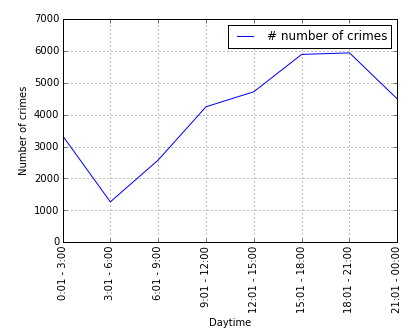
I converted the time format using the strptime() function to generate a consistent time format for the entire data set (HH:MM). I then counted the occurrence of each time, sorted the list, generated two different lists (time and count), and generated a pd.Series using time as index and count as data. Result is shown below (left panel)

|
|
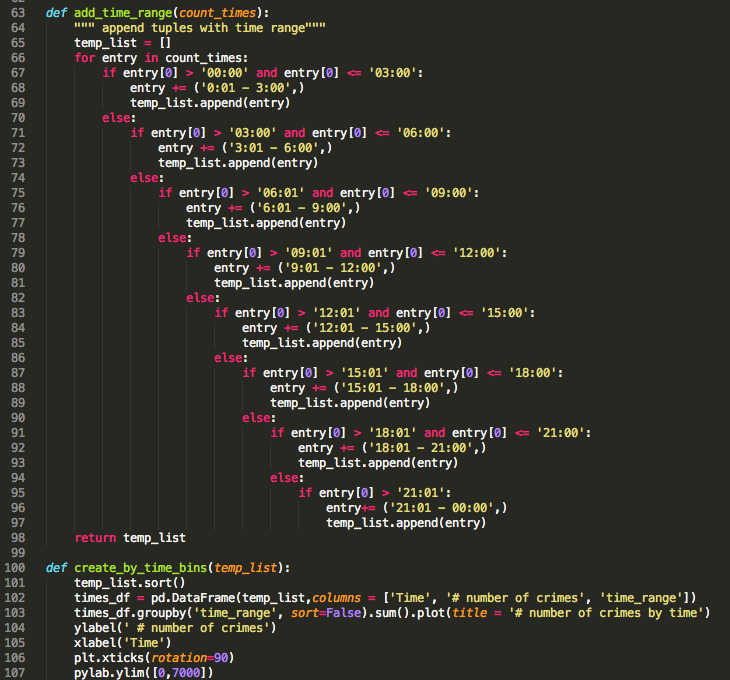
I am positive there is a shorter way, but the code below did what I had in mind: it added to each (time, count) tuple a time range information which then allowed me to plot the sum of all crimes falling into a specific time window (see graph on the right).
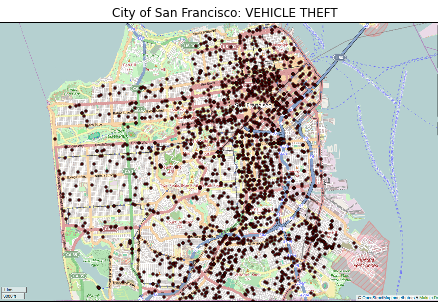
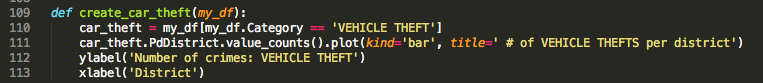
Living in New York, I typically commute by bike (which can be dangerous at times). Regardless, I was wondering how many cars have been stolen in the last three month and which districts have the highest number of vehicle theft. With just a few lines of code, voila:
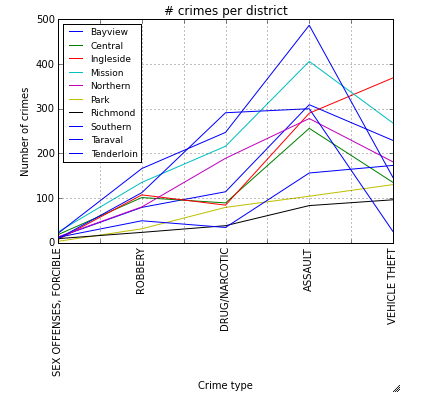
To maintain clarity, the plot below depicts only a selection of crime types. Nevertheless, it nicely illustrates that certain crime types occur more often in specific districts than others. The Southern district has the highest number of assaults, but ranks only 5th in the category VEHICLE THEFT.
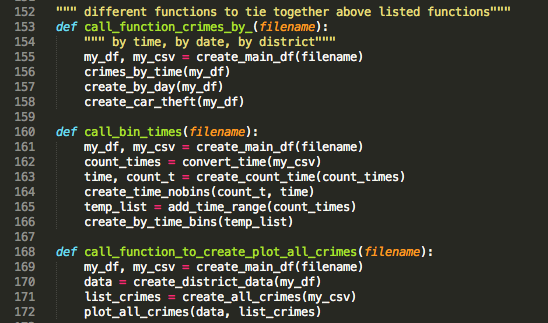
For completeness, please see the "call functions" below which are necessary to tie together all the smaller functions listed above. I have mentioned it before, it is easier for me to debug a problem working with smaller functions which then can be called and combined in a flexible manner.
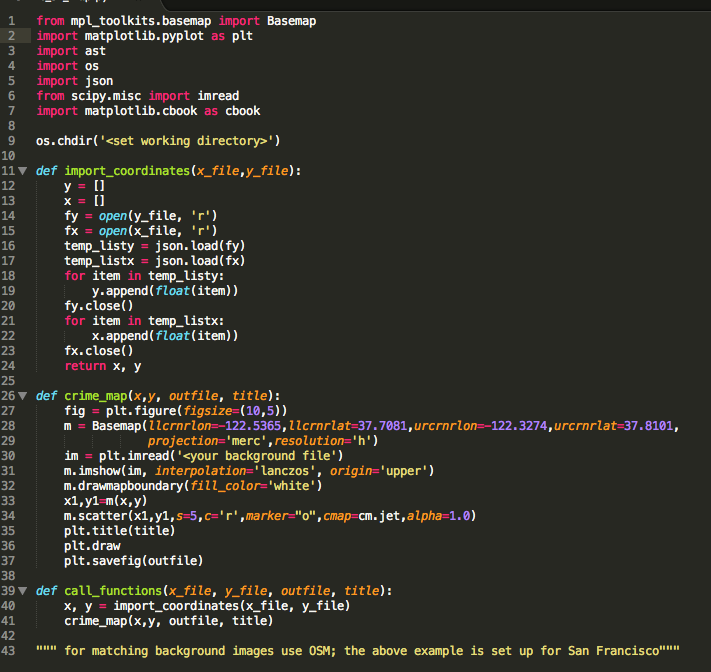
Lastly, I explored a new way of mapping data. Thus far, I have visualized results in form of world and U.S. State heatmaps. The data provides coordinates for each crime. I extracted the coordinates describing vehicle thefts in San Francisco districts and plotted each theft as dot on a city map.
Map 1.
Shows the District Boundary Map by the San Francisco Police Department.
Shows the District Boundary Map by the San Francisco Police Department.

San Francisco Police Department District Boundary Map
VEHICLE THEFT data; OpenStreetMap image used as background.